Same Note, Different Sound: The Measurement I Got Wrong First
Three waveforms at 528 Hz measure the same note and sound nothing alike. Chasing the reason turned up a number that should not exist, and my first attempt to measure it was wrong.
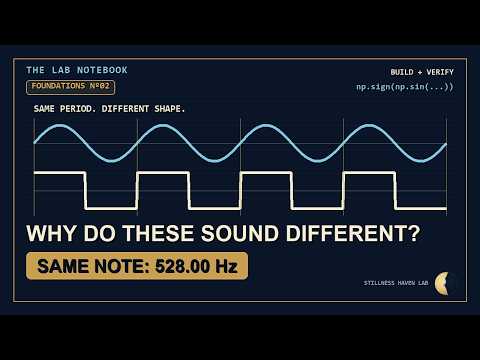
Play a sine wave and a square wave at the same frequency and nobody confuses them. One is soft, the other is harsh. Yet if you ask an instrument what note is playing, it gives the same answer both times.
That gap is the whole subject. It also led me to a number that, according to the theory, should not have been there at all — and my first measurement of that number was wrong, in a way worth showing rather than quietly fixing.
The note is not the sound
Build three shapes at 528 Hz in Python — a sine, a square, a triangle — and run an FFT on each. All three report a fundamental at 528.00 Hz. By note, they are identical.
What differs is everything standing above the fundamental. A repeating wave can be written as a stack of plain sine waves at whole-number multiples of that fundamental. Those multiples are harmonics, and which ones are present, at what level, is what your ear reads as timbre.
For a square wave the rule is old and specific: only the odd multiples survive, and each carries a fraction of the fundamental’s amplitude equal to one over its own number. A third of the amplitude at the third harmonic. A fifth at the fifth.
Measured on my own file:
| Harmonic | Predicted | Measured |
|---|---|---|
| 3rd | −9.5 dB | −9.5 dB |
| 5th | −14.0 dB | −14.0 dB |
| 7th | −16.9 dB | −16.9 dB |
| 9th | −19.1 dB | −19.1 dB |
The rule holds to the decimal place. That is the easy part.
The number that should have been zero
The same rule says the even harmonics should be missing entirely. Not small. Absent.
They are not absent. The second harmonic sits 75.9 dB below the fundamental — about one part in six thousand. Tiny, inaudible, and not zero. Theory said zero.
The obvious suspect is the measuring tool. It is not: run the identical measurement on a pure sine and the same bin reads 238 dB down, which is nothing but the arithmetic noise of the numbers themselves. The instrument can see far smaller things than this.
The real answer is that the sampled square wave does not repeat at 528 Hz at all.
Take the greatest common divisor of the frequency and the sample rate: gcd(528, 44100) = 12. The pattern of samples only comes back around twelve times a second, so what the transform sees is not a clean harmonic series but a comb with a line every 12 Hz. Some of those comb lines land near where a harmonic would be, and one of them is what shows up in the even bin.
Where I got it wrong
Here is the part the video spends real time on, because it is the part most channels would cut.
My first measurement of that even harmonic returned −67.3 dB, and I wrote it down as the answer.
It was not the answer. I had searched for the peak inside a window roughly ±14 Hz wide around the expected frequency, reasoning that a little tolerance would be forgiving. But the comb lines are 12 Hz apart. A window that wide is guaranteed to contain a neighbouring comb line, and that line was louder than the harmonic I was actually aiming at. The measurement dutifully reported the loudest thing in the window and I mistook it for the thing I asked about.
The correct value, read at the exact bin instead of the loudest thing near it, is −75.9 dB. Eight and a half decibels quieter than what I first published to myself.
The lesson generalises past this file: a tolerance window is not free. Widening it to be safe makes the measurement more likely to answer a different question than the one you asked. If you take one practical thing from this piece, take that.
Widening the window found something worse
Once I stopped trusting the narrow reading and looked at the whole spectrum, a bigger artifact appeared, and it has nothing to do with comb lines.
A square wave has harmonics forever. Everything above half the sample rate cannot be represented and folds back down into the audible range. At a higher note you can hear it without any analysis at all: build a square at 3000 Hz and there is a low tone underneath it that is not in the note. That is the fifteenth harmonic, at 45 kHz, folded back down to 900 Hz — two octaves below what is being played.
Back at 528 Hz the loudest fold sits at −33 dB. That is forty decibels above the even-harmonic artifact I had been chasing. The thing I was calling the artifact was not the big one.
Two tests confirm it is folding and not something else:
Double the sample rate and the folds drop six decibels, every time. −33, −39, −45, −51. Not luck: the first harmonic that no longer fits doubles its number, and a harmonic twice as high is six decibels quieter by the same one-over-n rule.
Build the same shape from sines that all fit — no infinite series, no edge to alias — and it drops to 236 dB down, back into arithmetic noise.
Three things timbre is not
Not the note. All three shapes measure 528.00 Hz. Ask the instrument what is playing and it answers the same thing three times.
Not loudness. Built to the same peak height, the square carries about 3 dB more energy than the sine. That is real, but it is a difference in crest factor — how tightly the same energy packs against the peak — not evidence that harmonics add loudness. Match the two by energy instead and the square’s own fundamental sits about 1 dB below the sine’s: same energy, spread across more steps.
Not quality. No shape here is richer or purer or better for you. What we measured is a distribution of energy across a staircase — six numbers for the square, six different numbers for the triangle, the same note underneath both. That is a complete description of a steady tone, and it is the entire claim the physics supports. A real instrument also changes while it plays, which is a separate question.
Try it, and read the exact bin
Four lines. Build a square at 528 Hz at 44,100 samples per second, take its FFT, and read the level at three times the fundamental and then at two times.
Read the exact bin, not the loudest thing near it, or you will reproduce my mistake. You should find −9.5 dB at the odd one and roughly 76 dB down at the even one.
Then change the frequency and run it again. The −9.5 will not move, anywhere from 100 Hz to 1000 Hz, because it is a law. The even number will move, and you can predict where before you run it: take the greatest common divisor of your frequency and 44,100, and that is the spacing of everything the sampling grid adds.
Both corrections above are in the published version of the video. Publishing the wrong number alongside the right one is not modesty; it is the only way a measurement claim can be checked by anyone other than the person making it.
References
The material here is definitional signal processing rather than clinical evidence: the discrete Fourier transform and its bin grid (numpy.fft), spectral leakage and window resolution, the Nyquist limit and aliasing, and the Fourier series for a square wave with its one-over-n odd-harmonic amplitudes. Implemented with numpy; the measurement script and its output are shown on screen in the companion video.
Educational content about audio signal processing. Not medical advice.
 Listen · FFT-verified session Same Note, Different Sound: The Measurement I Got Wrong First Watch on YouTube →